Week 4 Review: 6/25 - 6/29
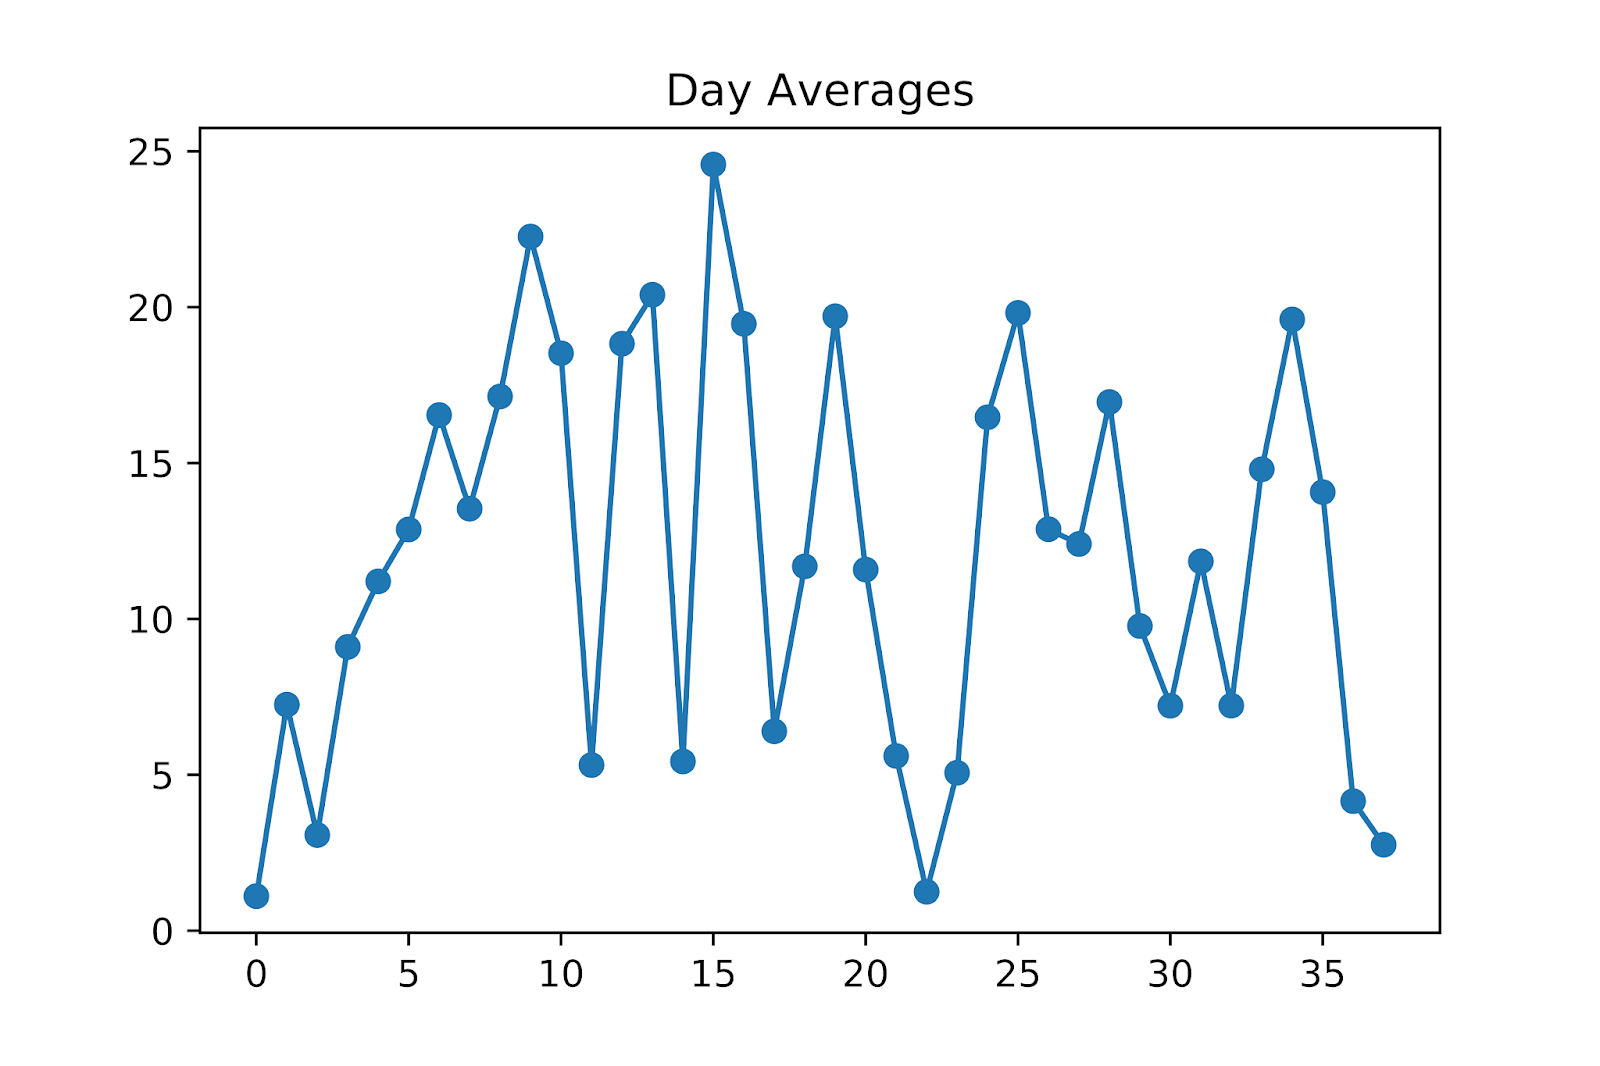
Next, we worked on representing data as averages in different sized time windows. We tried examples of hour long time windows with five minute throughput averages, day long time windows with hourly throughput averages, and a window of the entire cleaned data set with daily throughput averages. This technique will become extremely useful in the future of this project.


After my weekly meeting with my mentors on Thursday, I began working more directly with my project. Part of the new plan was to use PCA to determine the data's most prominent features. We do this by running PCA on a set of data and look at the first component's explained variance and subcomponents. A setback during this process was that the subcomponents of the first component weren't labeled, so we couldn't directly match subcomponent values with their feature name. At the tail end of Friday, I was able to solve this issue and now the code runs smoothly and quickly. My next steps are to try different scaling methods before PCA to see if it affects the results of finding the most prominent features. Then I can cluster data in time windows.


Comments
Post a Comment