Week 3 Review: 6/18 - 6/22
This week I've taken a closer look at my data and which measurements I may be studying more than others. Because so many variables are measured in the Tstat data, there will certainly be some that are much more relevant than others. I have consulted papers on similar studies to help determine which variables aren't of any use so I can focus on the ones that are relevant.
Also in these studies were some experiments. Throughout the week, I have tried to replicate two of these experiments, one from two separate papers. One uses Tstat data like my own and the other uses data retrieved and processed here at Lawrence Berkeley National Laboratory in the Nersc Center. Because Alex Sim, one of my mentors, was an author of the second paper, he gave me access to the exact same data from the paper to try to recreate the experiment.
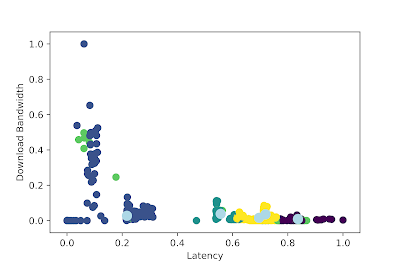
For the first experiment, I analyzed a 41.4 MB zip file using the same methods of cleaning, column calculation, and clustering as the paper. The paper mentions that the file they use for this experiment is called "log_video_complete_all" where I am using a mere fraction of my total data. This suggests the previous experiment was conducted with a much larger amount of data than mine and accounts for the dissimilarity between our clusters.
It is likely that because I had far less data, scaling so that my maximum is 1 and minimum is 0 doesn't accurately represent the data placement in relation to the original graphs.
In the second experiment, I selected columns of data, cleaned, and used the log function to scale both axis. Because I followed the exact procedure from the paper and I have the same data, I should have gotten an exact match for every graph. However, this was not the case. It appears that there is less data in my graphs than the ones in the paper. This could mean I cleaned the data differently than the paper authors or somehow the file I used has lost data. Out of 16 graphs, graph 6 appears most similar in point placement and cluster identification.
Also in these studies were some experiments. Throughout the week, I have tried to replicate two of these experiments, one from two separate papers. One uses Tstat data like my own and the other uses data retrieved and processed here at Lawrence Berkeley National Laboratory in the Nersc Center. Because Alex Sim, one of my mentors, was an author of the second paper, he gave me access to the exact same data from the paper to try to recreate the experiment.
For the first experiment, I analyzed a 41.4 MB zip file using the same methods of cleaning, column calculation, and clustering as the paper. The paper mentions that the file they use for this experiment is called "log_video_complete_all" where I am using a mere fraction of my total data. This suggests the previous experiment was conducted with a much larger amount of data than mine and accounts for the dissimilarity between our clusters.
 |
| Experiment Recreation of Figure 15 |
In the second experiment, I selected columns of data, cleaned, and used the log function to scale both axis. Because I followed the exact procedure from the paper and I have the same data, I should have gotten an exact match for every graph. However, this was not the case. It appears that there is less data in my graphs than the ones in the paper. This could mean I cleaned the data differently than the paper authors or somehow the file I used has lost data. Out of 16 graphs, graph 6 appears most similar in point placement and cluster identification.


Comments
Post a Comment