Research Update 4 ~Alex
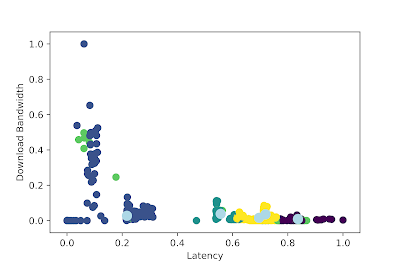
After the craziness of week 3, week 4 has seemed relatively calm. At the beginning of the week I was simply finishing up what my breakthrough last week enabled me to. The new variables are fully created and we are in the process of comparing them to the variables from the survey. We are also starting to focus on how we will be able to visualize our data. Because of the longitudinal and high dimensional nature of our dataset, it is almost impossible to visualize without manipulation. To reduce the number of dimensions, we decide to employ t-sne (a dimensional reduction algorithm). T-sne can take hundreds of thousands of dimensions down to 2 which is much easier to visualize. T-sne can be a little touchy though, so right now we are carefully tuning the parameters, especially perplexity, a number that tells the algorithm whether to prioritize the global or the local aspects of the data (basically a guess on how many neighbors each point has). A graph with the data sets we're focused o...

